

eCommerce organizations today are facing a new problem - it is getting more and more difficult to trust and use data to your advantage. More data is not always a good thing. The more data flowing into an organization, the more likely it is going to be misinterpreted and/or misused.
This hasn't always been the case. In fact, no more than a decade ago the eCommerce market was scurrying to find new and better data at every touchpoint. So, how did we get here?
The eCommerce Cookie Data Challenge
To understand how we got here, it's important to understand the history of cookie-based data. For a long time marketers could rely on first and third party cookies to collect all kinds of audience data. It started predominantly with Google in terms of paid media. And then, as more marketplaces popped up, the complexity grew exponentially.
Then, just as the market was getting a handle on all of this cookie-based data, the release of new privacy options in the iOS 14.5 update has pushed the market away from cookies.
Customer Journey Tracking is Broken
A lot of the of the conversations that happens internally at eCommerce companies are focused around: "is the paid media really working? What is it returning? How much budget should we allocate to for customer acquisitions? What should that mix be between top of the funnel, mid-funnel, bottom of the funnel and retention?"
They are trying to get a clear picture of the customer journey and where the best are the places to spend marketing money based on it. There are three main sources of of data that e-commerce brands rely on for this decision making: native marketing data (Google, Facebook, Amazon, etc.), shopping cart data, and website analytics data.
These different data sources can all provide some conflicting information, but let's look at an example we see a lot in attribution: double counting and under-reporting.
What we're really looking for is the relationship between these data sets. Then you can clean up those issues and make good marketing decisions based on that data. But, not necessarily good financial decisions.
To do that, you're going to start incorporating your website analytics and shopping cart data to look at what happens throughout the funnel. You need to decide what data from those three sources are important to decision making based on your goals.
Note: We see most eCommerce companies focus mainly on the campaign marketing data and ignore the others.
Challenges Tracking Revenue Resulting from Ad Spend
The economy changed a lot within last year. And with that came a change in the marketing conversation. Where it was once about those channel marketing metrics we just mentioned, it's now about the top line revenue growth, profitability and efficiencies. This shift has put a lot of focus on trusting the data because efficiency is driven and based on using reliable data.
For example, we sometimes see companies missing 20-40% of their revenue reporting on ad spend because of the inability to properly track it. And on the flip side, we also see double counting issues where revenue is over-reported. It get's messy.
Well, if you're getting inaccurate revenue data resulting from ad spend, then you can't have useful strategy conversations about how to spend properly.
The Profitability Problem & CFO Interest
Until recently, the eCommerce mantra was "Growth at all costs." And it was working, so marketers didn't care to look so closely under the hood at the sort of financial implications of some of their media spend.
But now, in an age of profitability and efficiency, the CFO wants to know more than just ROAS, impressions, and marketing metrics. The CFO wants to know is the media spend is actually driving the business profitably.
You can't have that conversation with just campaign metrics. You need to start looking at the relationship between ad spend and revenue - Attribution Models.
A lot of companies we see use the last quick model and base all decisions on that. But we know from our site analytics that it usually takes more than one click to drive a conversion. But, let's say that you have a last click model and you pay for a Google PMax click. Then you hit that visitor who clicked with a Facebook retargeting ad and they end up converting. You model would give all of the credit for that conversion to Facebook. But we know you wouldn't have gotten that Facebook ad click if it weren't for the Google retargeting. So, you should attribute that revenue between Facebook AND Google.
In this scenario, if you use the last click attribution model, the resulting budget decision will likely be to take budget away from Google and put it toward Facebook. But because the conversion NEEDED that Google retargeting to occur, more putting more money into Facebook while pulling out of Google doesn't result in more Facebook conversions. You have to find the right mix between those channels by understanding how they feed and compliment each other.
So, when it comes to optimizing to drive sustainable revenues long term, you have to give full credit to both channels because you couldn't get the conversion without both clicks.
This is how you have the conversation at the CFO level about marketing spend throughout your channels. This is a more complex ecosystem than single channel metrics can explain. Reporting this way is not about giving credit for conversions, it's about finding the relationships between marketing programs that drive the most profitability.
Identifying the Best Metrics to Maximize Value
The native advertising channel data is really useful for figuring out where you spent the media budget and the the revenue outcome from the spend. The goal then is to explore those relationships and try to replicate them as much as we can to drive the efficiency.
But when it comes to modeling eCommerce revenue operations, you want to know how much it costs to get a new customer how effectively can you drive repeat revenues from that customer?
Now, these things are are industry and category specific. If you're selling bikes, for example, people don't go buy a new bike every 3 months. There are different lifespans to products. You should try to understand these cycles to begin building a strategy for profitable revenue generation and expectation setting.
The best way to do this is to get a wholistic view of all three data types we've discussed. We have integrations into out platform to do just that and that's how we are able to get this visibility and make decision for clients.
Most eCommerce companies are already using the Customer Acquisition Cost (the old CPA model) to drive decisions. That's only one side of the equation. You need to also consider the Lifetime Value of customer (CLV) to really understand how to act on the data. Let's look at an example:
- You pay $50 to get a new customer.
- You make $100 from that customer - a 50% margin.
- Your product cost and shipping cost is $60 - now margin is negative.
This data would lead you to the conclusion that it's not worth acquiring net-new customers. So, you lower your target for acquiring new customer and pull budget away.
But what you don't know because you're only looking at marketing data:
- New customers on average buy 3.5X the original purchase amount within 18 months of the purchase.
- 18-month CLV = $350
- 18-month margin = $300
Now you're campaigns are profitable. With this knowledge, you'd make a much different decision on marketing spend. When you put this in context of every click that you buy in any marketplace is done in an option environment, you realize that whoever has the best, most accurate data wins in the long run.
This is about modeling your revenue operations as opposed to trying to win a marketplace click auction, right? Marketing teams are moving into a much more sophisticated strategic conversation now.
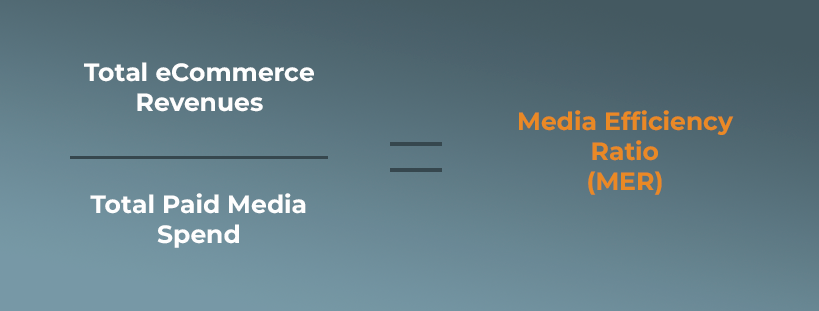
In the ned you want to be talking about the relationship between total marketing costs and total output? Something we're now calling MER - Marketing Efficiency Ratio.
The metrics to focus on to make better decisions:
- MER (marketing efficiency ratio) - total revenue divided by total marketing spend.
- CAC - New Customer Acquisitions Costs
- Customer Retention Cost - how much it costs to bring a customer back.
- LTV - Lifetime Value of a Customer.
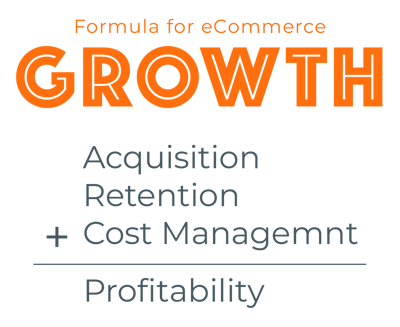
With these you have a very clear picture of the value creation inside your eCommerce revenue operations model and you can plan for growth.
This is the type of data that businesses have used forever. It just hasn't been prevalent in eCommerce because there is a distrust of data from on the revenue side and the siloed nature of the eCommerce business structure. Performance Marketing just never coordinated with the RevOps finance side of the business. It didn't need to until now.
Breaking this silo has been a big initiative for Finch within our customer base. We've seen incredible result among our clients who take it seriously.
Not only does it help create a more accurate picture of the business, but it also instills and builds trust between marketing finance to actually recognize what it is that they're doing as a mutual business effort.
Finance and marketing need to be on the same page to maximize growth. And you can do that when you talk about hard metrics like real costs and real profit.
Framing the Marketing Conversation for a Finance Audience
CFOs and the accounting function of your business want all of the data match up before they will even entertain these conversations. Anyone who's tried to match advertising data, website analytics data, shopping cart data know that this is an impossible task. It's just never going to work.
That why, instead, we're suggesting these new metrics that will, by nature, always match to numbers finance trusts - revenue and spend.
For example, the last thing you want to be doing is trying to explain the value of view-through conversions to a CFO. It's certainly possible, but the most likely outcome is more confusion and less alignment. Instead, talk about the metric we're talking about here: CAC, CLV, MER, etc.
This reframes the budgeting conversation to a point where marketing and finance can speak the same language and make better decisions.